XRP is flashing a major breakout signal, analyst says
XRP is flashing a major breakout signal, analyst says 
![]() Cryptocurrency Mar 11, 2026 Share
Cryptocurrency Mar 11, 2026 Share
XRP has declined 2.5% over the past 24 hours to around $1.38, moving largely in line with the broader crypto market as investors become more cautious ahead of key U.S. inflation data scheduled for today, March 11.
The pullback, then, appears primarily macro-driven, with digital assets retreating as traders await the latest reading of the U.S. Consumer Price Index (CPI), a major inflation gauge that could influence the Federal’s decisions going forward.
However, technical indicators are also starting to suggest that a significant volatility event may be approaching. Namely, the daily XRP chart is showing signs of a Bollinger Band squeeze, a pattern that typically occurs before a sharp price move, according to analyst Ali Martinez.
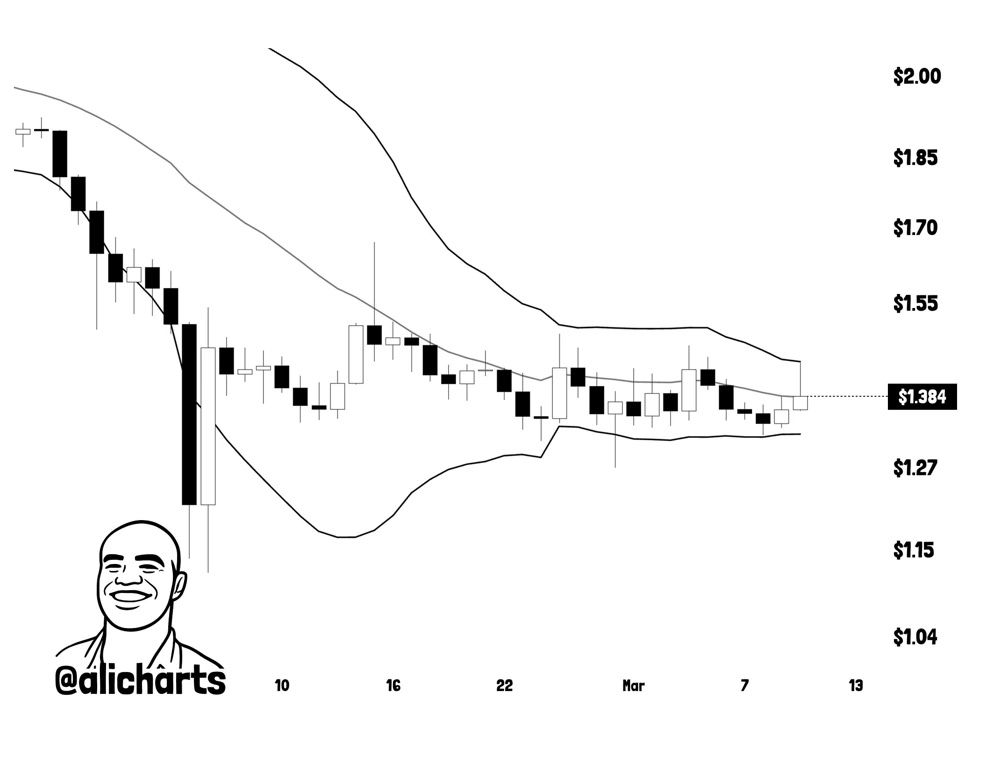 XRP Bollinger squeeze chart. Source: Ali Martinez (@alicharts)
Bollinger Bands are squeezing, suggesting $XRP could soon see a spike in volatility! pic.twitter.com/WZUYxzcTkd
— Ali Charts (@alicharts) March 11, 2026
XRP volatility incoming?
Developed by financial analyst John Bollinger in the 1980s, the Bollinger Bands are a widely used technical analysis indicator that measures price trends and market volatility. As the bands tighten, a breakout in either direction tends to follow, signaling that XRP could be nearing a decisive short-term move.
In short, when markets become more volatile, the bands widen as prices swing more aggressively. When volatility drops, they squeeze, indicating that price movements are becoming increasingly muted.
Because markets often alternate between periods of low and high volatility, the squeeze frequently precedes a significant breakout. In the case of XRP today, the Bollinger Bands are tightening, meaning that volatility has fallen to unusually low levels and is waiting to explode.
Combined with macro uncertainty ahead of the latest U.S. CPI data, the setup suggests XRP may soon break out of its current range, with key levels around $1.42 on the upside and $1.35 on the downside likely to determine the direction of the next move.
XRP price outlook
XRP appears to be approaching an important inflection point from a broader technical point of view. As mentioned, the cryptocurrency is testing resistance near $1.42, which coincides with the 38.2% Fibonacci retracement.
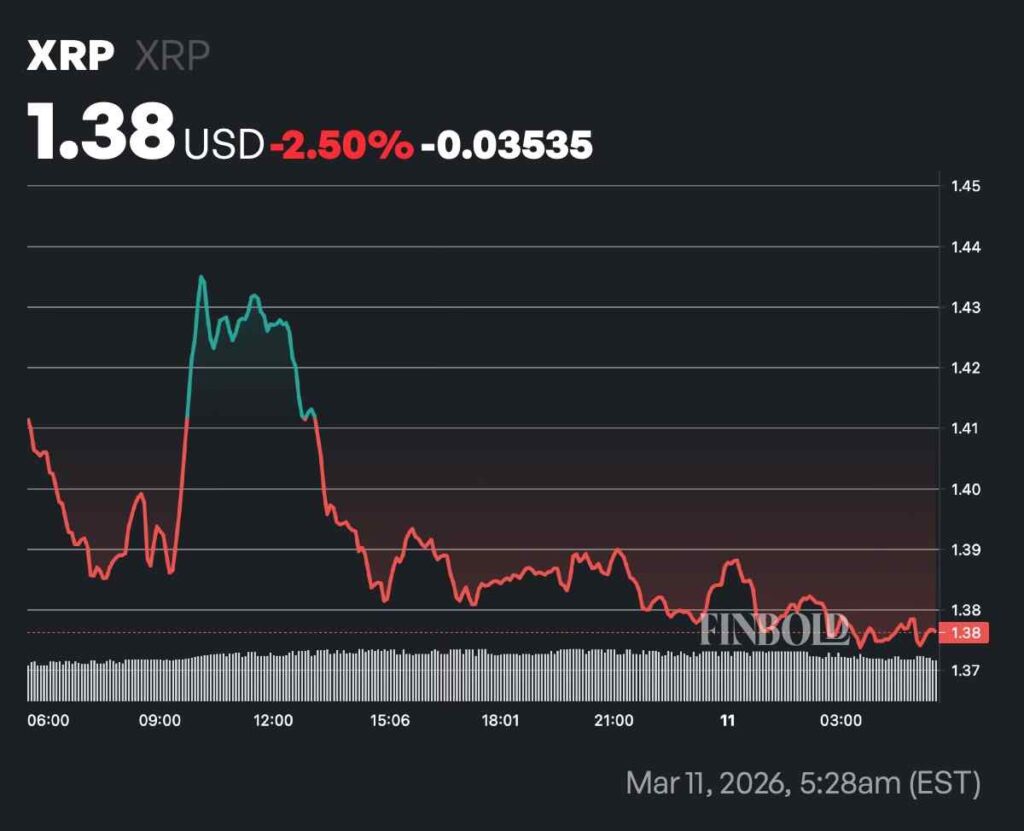 XRP price. Source: Finbold
A decisive break above that could lead to an inverse head-and-shoulders pattern, potentially opening the path toward $1.67. However, failure to maintain support around $1.35 could push the price toward the $1.30–$1.32 range.
Featured image via Shutterstock