Warning Pattern on Bitcoin Chart Puts $100,000 in Danger
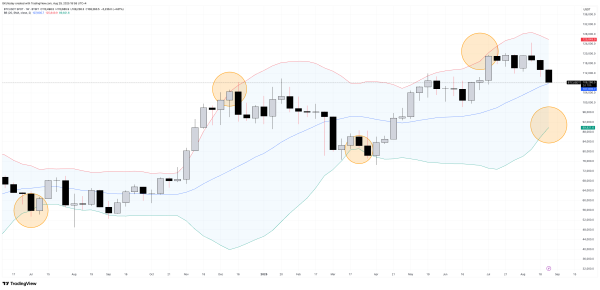
The weekly chart of Bitcoin starts showing warning signs that could have serious consequences. The Bollinger Bands, in particular, show that the price might drop below $100,000. That is a line that has been a major support level for the whole crypto market, both technically and in a psychological sense.
The setup is clear on the one-week time frame: Bitcoin rejected the upper band near $124,000 and is now sliding back toward the midline around $107,000. BTC has hit the top of this channel several times in the past, and each time, it has dropped after a short rise.
If the midband does not hold, the lower edge of the structure comes into play near $88,000, which would mean a loss of the six-figure price point.

The pattern is important because it is consistent. Earlier this year, a dip into the lower band marked the start of a strong rebound, while rejections in March and July signaled extended drawdowns.
This latest move looks a lot like those earlier reversals, so it seems like the market might be entering a corrective phase again, even though there was optimism after the $124,000 peak.
What’s next for Bitcoin?
The outside world is making the situation more fragile. With Bitcoin, the combination of technical rejection and macro uncertainty make it more likely that there will be a deeper retreat if buyers cannot hold the $100,000 level.
For now, the $100,000 line is being used as the dividing point. If it closes below that this week, it will confirm the Bollinger Bands signal and bring attention to $88,000 per BTC as the next big thing to watch.


