This XRP competitor set to go parabolic
This XRP competitor set to go parabolic 
![]() Cryptocurrency Aug 26, 2025 Share
Cryptocurrency Aug 26, 2025 Share
Stellar (XLM), a direct competitor to XRP in cross-border payments, may be on the verge of a major breakout after months of sideways movement, with technical signals pointing to a potential parabolic rally.
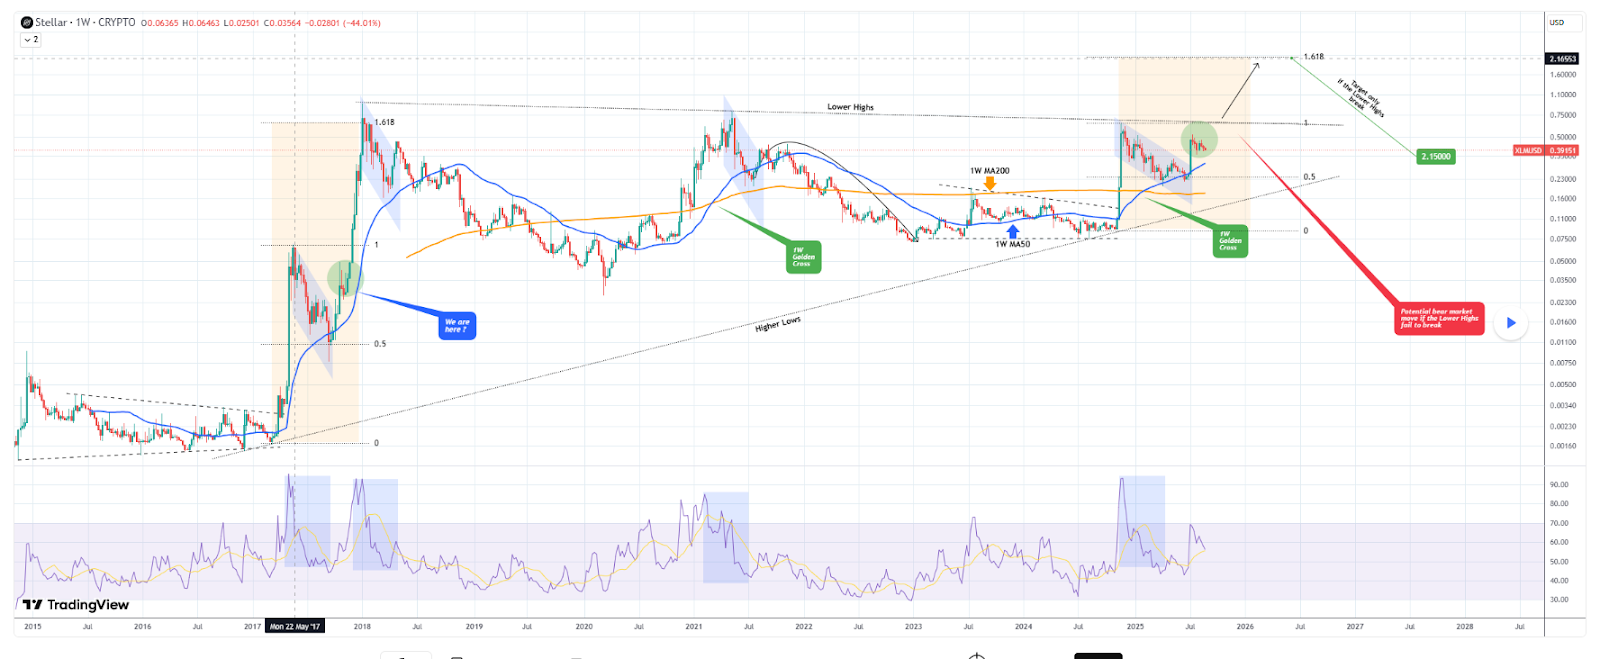
According to TradingShot’s analysis shared in a TradingView post on August 25, since the July 14 weekly high, Stellar has consolidated while remaining supported by its 50-week moving average.
 XLM price analysis chart. Source: TradingView
This price action fits within a broader multi-year ascending triangle pattern, with the latest consolidation resembling a bull flag. Historically, similar setups have marked the beginning of explosive rallies.
Notably, the same structure appeared in late 2017. After holding the MA50 during that period, Stellar staged a parabolic rally, peaking just above the 1.618 Fibonacci extension level.
Currently, attention is on whether Stellar can break through the top of its triangle, which is defined by the lower-highs trendline.
A successful breakout would confirm the resumption of the bullish trend and open the path toward $2.15, the projected target based on the 1.618 Fibonacci extension.
A weekly bullish golden cross further supports the outlook. The last time this signal appeared was in the previous cycle, just before Stellar hit its peak, suggesting that while the upside potential is significant, timing will be critical.
XLM price analysis
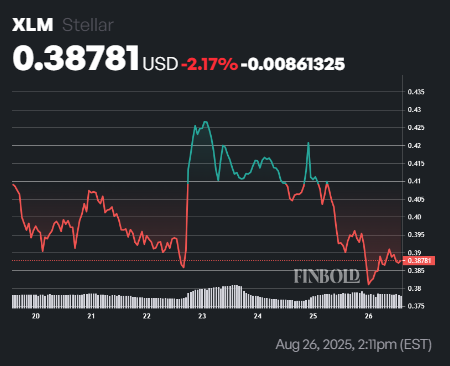
At press time, XLM was trading at $0.39, down 0.58% in the past 24 hours. On the weekly timeframe, the asset has also slipped over.
 XLM seven-day price chart. Source: Finbold
From a technical perspective, XLM’s 50-day Simple Moving Average (SMA) is $0.41832, indicating the price is currently below this short-term trend line, which may suggest a bearish momentum in the near term. The 200-day SMA at $0.25501 shows a significant long-term upward trend, as the current price is well above this level.
Meanwhile, the 14-day Relative Strength Index (RSI) is 41.53, which is in the neutral zone (neither overbought nor oversold), suggesting there is room for movement in either direction without immediate extreme pressure.
Featured image via Shutterstock


