The Calm Before the Crypto Storm: Bitcoin Preps for a Technical Twist
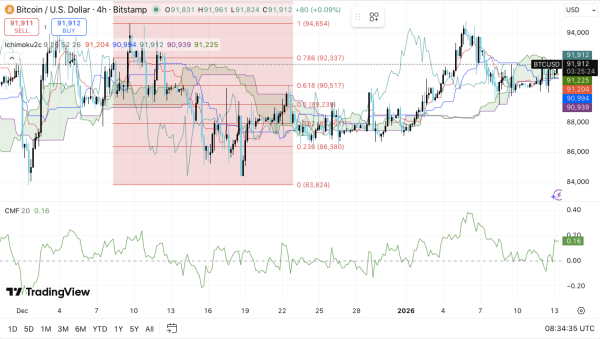
On Tuesday morning (8:30 a.m. EST), bitcoin’s price action danced between $91,800 and $92,479 today, carving out a narrow but significant range in a broader game of “will they or won’t they” among traders. With a market cap firmly seated at $1.83 trillion and a hearty $44.68 billion in 24-hour trading volume, the king of crypto seems to be eyeing a fresh move. Intraday, the price pivoted between $90,128 and $92,479—suggesting that while resistance holds strong, the bulls aren’t exactly backing down either.
Bitcoin Chart Outlook
From a macro lens, the daily chart reveals a sideways grind with a not-so-subtle bullish undercurrent. After rallying from approximately $84,000 to $94,800—a tidy 12.3% sprint— bitcoin has simmered into a stabilizing groove above the $91,000 mark.
That retracement might look like hesitation, but beneath the surface, momentum is gathering like guests at an afterparty. Lower volume post-rally signals indecision, not defeat, as the asset consolidates gains. If bitcoin can maintain altitude above $90,000, there’s a strong case for a continued move toward $94,500–$95,000, as long as traders don’t blink first.
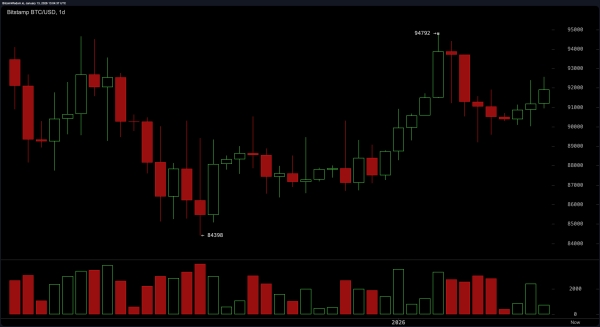 BTC/USD 1-day chart via Bitstamp on Jan. 13, 2026.
Zooming in on the four-hour chart, bitcoin’s rounded bottom formation from the $89,200 low whispers of quiet accumulation. This mid-term snapshot shows a slow but deliberate recovery to the current price zone. A low- volatility stretch from January 10–12 adds evidence of coiling energy, ready to snap if sparked by volume. Key support rests near $89,199, while a clean push above $92,500 could energize a test of $93,700 to $94,000. Until then, it’s a waiting game—though the bulls seem to be holding the better hand.
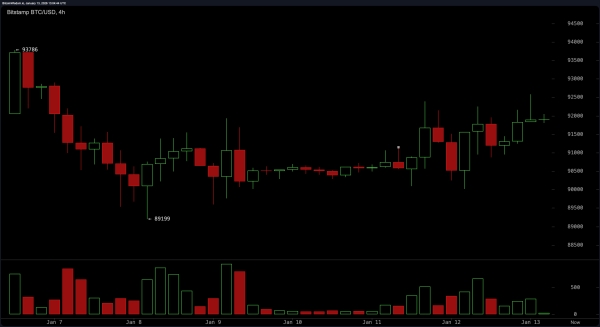 BTC/USD 4-hour chart via Bitstamp on Jan. 13, 2026.
The hourly chart paints a tighter, more tense narrative. Bitcoin remains boxed between $91,000 and $92,500, teasing traders with several failed breakouts. The $92,576 resistance level acts like a velvet rope at an exclusive club: many try, few enter. Buyer exhaustion looms as volume wanes on each approach, leaving the short-term bias neutral to slightly bullish. Only a convincing break above the ceiling—with conviction in volume—will signal this range is ready to be retired.
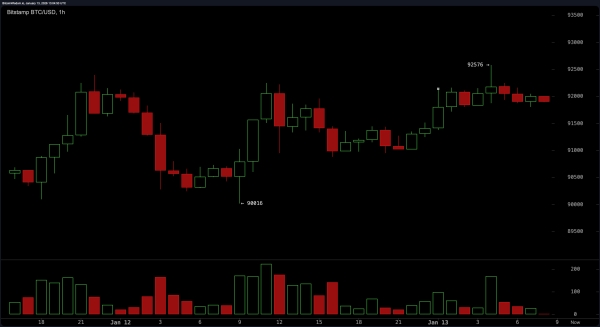 BTC/USD 1-hour chart via Bitstamp on Jan. 13, 2026.
Oscillators suggest that bitcoin is keeping its cool. The relative strength index ( RSI), Stochastic oscillator, commodity channel index (CCI), and average directional index (ADX) all hover in neutral territory. But three standouts—momentum, the Awesome oscillator, and the moving average convergence divergence ( MACD)—flash positive signals. Translation? Bitcoin may not be sprinting, but it’s stretching and warming up for a potentially bullish jog.
Moving averages (MAs) also show their hand. From the 10-period to the 50-period ranges, both exponential (EMA) and simple (SMA) moving averages cluster below the current price, backing the bullish tilt. However, the longer-term 100- and 200-period EMAs and SMAs remain bearish—indicating bitcoin still has some heavy lifting to do before flipping the entire script. It’s a classic case of short-term optimism battling long-term skepticism, and right now, the near-term technicals are winning the argument with a smirk.
Bull Verdict:
The structure is firming, momentum is ticking, and short-term averages are lining up like dominoes in favor of the bulls. With consolidation above $91,000 and three key oscillators flashing green, bitcoin appears to be mustering strength for a decisive move. If volume joins the party above $92,500, the breakout crowd might just get their headline moment.
Bear Verdict:
Despite the flirtation with higher levels, the lack of volume on recent rallies and the drag from longer-term moving averages paint a more cautious picture. Resistance at $92,500 remains stubborn, and any dip below $90,000 could reopen the gates to deeper retracement. Until then, the bear case remains on the table—quiet, patient, and watching.
FAQ 🐂 🐻
- What is bitcoin’s current price range? Bitcoin is trading between $91,800 and $92,479 as of January 13, 2026.
- What are key support and resistance levels for bitcoin today?Support sits near $90,000, while resistance holds firm at $92,500.
- Is bitcoin showing bullish or bearish signals?Short-term indicators lean bullish, but long-term averages remain bearish.
- What’s bitcoin’s market cap and trading volume today? Bitcoin’s market cap is $1.83 trillion with a 24-hour volume of $44.68 billion.