Machine learning algorithm predicts Bitcoin price for April 1, 2026
Machine learning algorithm predicts Bitcoin price for April 1, 2026 
![]() Cryptocurrency Mar 20, 2026 Share
Cryptocurrency Mar 20, 2026 Share
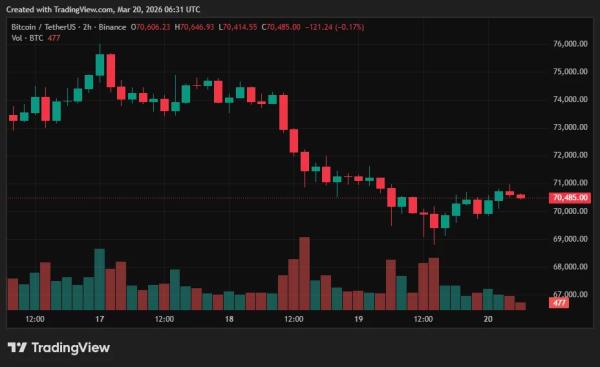
Despite some bouts of heightened volatility, Bitcoin (BTC) has somehow managed to keep its head above water this month, being up more than 4% at the time of writing.
However, all the uncertainty regarding the current geopolitical situation continues to cloud the asset’s near-term outlook, even as institutional appetite grows.
Bitcoin has also been trading within a tight range, consolidating between its 30-day Simple Moving Average (SMA) at $68,857 and the 7-day SMA at $72,130, with momentum indicators remaining neutral.
This uncertainty is likewise reflected in where the leading large language models (LLMs) see the cryptocurrency landing by the end of the month.
AI predicts Bitcoin price on April 1, 2026
For example, Finbold’s AI prediction agent, which combines the outputs from Gemini 3 Flash, ChatGPT 5.2, and Grok 4.1, projects an average BTC price of $72,565 on April 1, 2026, suggesting a modest 2.54% upside from the current price of $70,769.
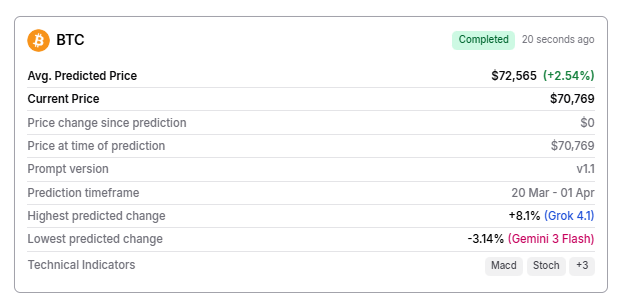 BTC price prediction. Source: Finbold
However, when one compares each individual algorithm, the result obtains another dimension.
Namely, while OpenAI’s and xAI’s chatbots are bullish, predicting that the Bitcoin prices would go up 2.66% and 8.1%, respectively, their Google counterpart has a completely different idea.
That is, the analysis given by Gemini suggests traders ought to prepare for a somewhat lower price of $68,546, which implies a 3.14% downside.
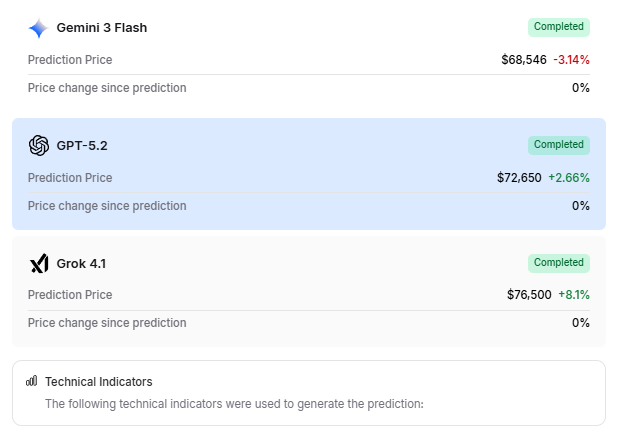 LLMs predict BTC price for April 1. Source: Finbold
In other words, the average Bitcoin price target for April 1, 2026, is the result of three rather disparate takes that see the asset trading anywhere from below its 30-day SMA to highs not seen since early February.
Bitcoin price outlook
The current price action suggests that Bitcoin is holding above a key medium-term average as the total cryptocurrency market capitalization reflects muted activity (up just 0.08%). A daily close above the 7-day SMA at $72,130, however, would likely indicate a return of short-term bullish momentum.
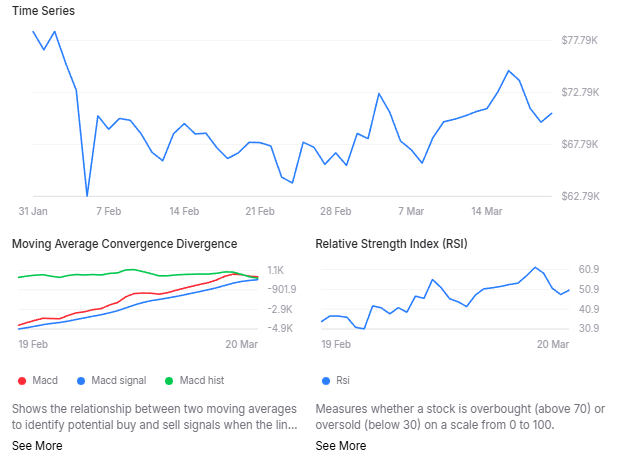 BTC technical analysis. Source: Finbold
In the short term, Bitcoin’s trajectory will also likely hinge on whether it can maintain support at the $70,856 Fibonacci level. Sustained strength above that could bring the 7-day SMA resistance at $72,130 into consideration. On the downside, though, a break below the 30-day SMA at $68,857 could lead to a deeper pullback.
Featured image via Shutterstock