Expert sets condition for XRP’s drop to $1
With XRP largely remaining bearish, a trading expert has pointed out that technical indicators suggest that if the losses continue, the asset might drop toward the $1 zone.
Indeed, XRP has invalidated recent gains, aligning with the broader cryptocurrency market sentiment as the asset continues to struggle to breach the $1.50 resistance level.
Regarding the outlook, prominent cryptocurrency analyst Ali Martinez has identified a key technical level that could determine whether XRP declines toward the $1 psychological support or rallies toward higher resistance levels.
In an X post on May 19, Martinez noted that XRP’s three-day chart is showing its tightest Bollinger Band squeeze in more than a year, a setup that often signals a sharp volatility spike after a prolonged period of price compression.
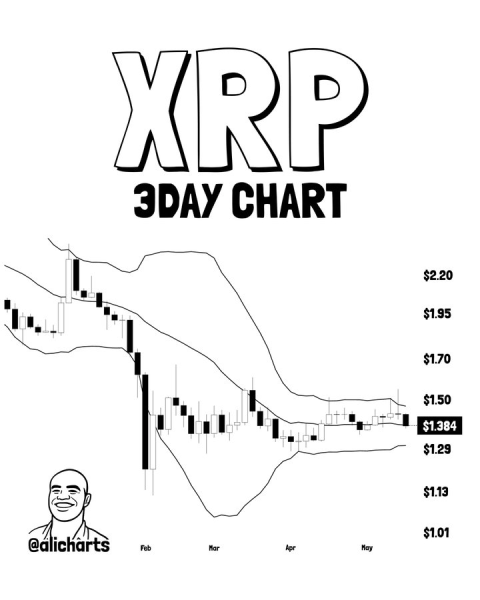
XRP price analysis chart. Source: Ali Martinez
XRP was trading around $1.38 while consolidating between $1.29 support and $1.50 resistance, with price action remaining largely sideways since late March as volatility continued to decline.
According to Martinez, a decisive three-day candlestick close outside this range could determine XRP’s next major move.
XRP’s path to $1
A breakout above $1.50 may fuel bullish momentum toward $1.80, while a drop below the $1.29 support zone could invalidate the near-term bullish outlook and raise the risk of a deeper correction toward $1.
The analysis also highlighted XRP’s broader downtrend since February, when the token fell from above $1.90 before stabilizing in its current consolidation range.
Since then, the cryptocurrency has struggled to sustain upward momentum, facing repeated resistance near the upper Bollinger Band.

Not Trading, Not Staking: The New Crypto Strategy Generating Up to 24% APY
Crypto investors continue to look for consistent ways to earn returns without relying on unpredictable market cycles. Traditional strategies often … Continue reading
Featured Press Release Apr 9, 2026
The tightening Bollinger Bands suggest XRP is approaching a critical inflection point, with traders closely watching whether the token can reclaim resistance or break lower.
It is worth noting that XRP has been weighed down by the general weakness in the broader cryptocurrency market despite several bullish fundamentals.
In this line, despite pulling back from 2025 highs near $3.65, XRP holders remain optimistic amid strong institutional signals.
Spot XRP ETFs have recorded robust inflows, with a recent weekly high of $60.5 million and May totals exceeding $94 million so far.
Cumulative assets under management for U.S. spot XRP ETFs now approach or surpass $1 billion to $1.28 billion, with no major net outflows in recent streaks, and XRP tokens locked in these products nearing 887 million.
XRP price analysis
By press time, XRP was trading at $1.37, having dropped 0.56% in the last 24 hours, while on the weekly timeframe, the asset has declined more than 5%.
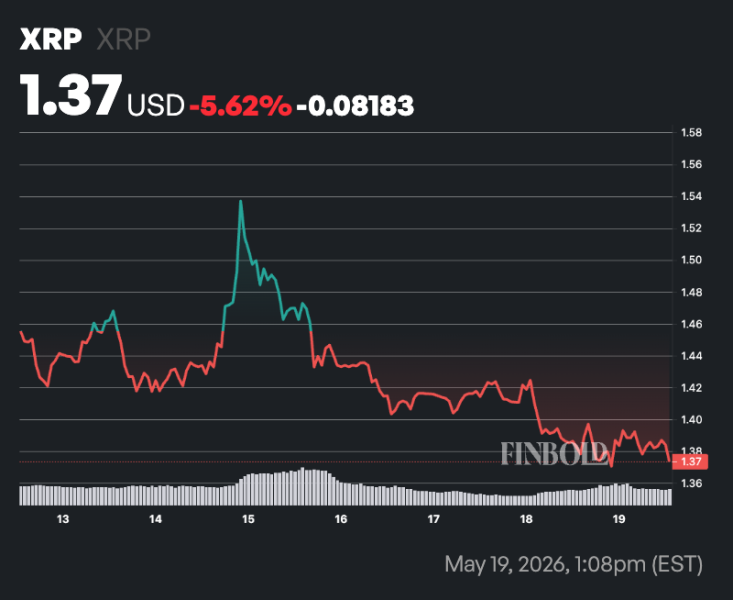
XRP seven-day price chart. Source: Finbold
Technically, traders are closely watching key price levels as immediate support lies between $1.35 and $1.38, with stronger support around $1.29 to $1.32.
On the upside, resistance stands between $1.42 and $1.50. A breakout above $1.50 could push XRP toward $1.60 to $1.70, while a drop below $1.35 may trigger further downside pressure.