BlackRock sold over $350 million of this cryptocurrency in a week
BlackRock sold over $350 million of this cryptocurrency in a week 
![]() Cryptocurrency Aug 23, 2025 Share
Cryptocurrency Aug 23, 2025 Share
BlackRock’s spot Ethereum ETF (ETHA) had one of its most turbulent weeks, with trading activity dominated by large-scale outflows before staging a sharp rebound.
The world’s largest asset manager sold a total of $351.3 million worth of Ethereum (ETH), equivalent to about 84,000 ETH, across three sessions between August 18 and August 20, according to data from Coinglass.
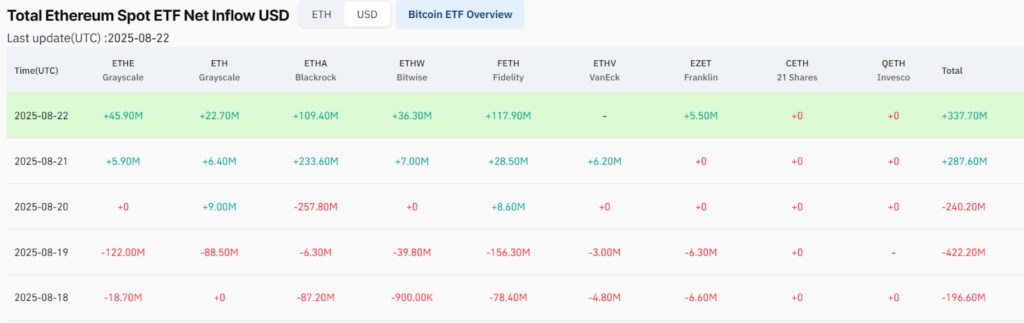 Ethereum ETF net inflow. Source: Coinglass
The heaviest selling came on August 20, when BlackRock’s fund posted $257.8 million in redemptions, marking the single-largest daily outflow of the week. Earlier, on August 18, the ETF shed $87.2 million, followed by a smaller sell-off of $6.3 million on August 19.
Despite the outsized outflows, momentum shifted later in the week. On August 21, BlackRock attracted $233.6 million in Ethereum inflows, followed by an additional $109.4 million on August 22.
Across all issuers, Ethereum spot ETFs recorded net weekly outflows of $233.7 million. BlackRock’s activity dominated, with its $351 million in sales accounting for more than 85% of total redemptions during the sell-off days.
Ethereum rallies to new highs
Indeed, the renewed institutional interest contributed to Ethereum reaching new highs. The second-largest cryptocurrency by market cap notched another record, buoyed by optimism around ETF demand.
The rally also gained support after Federal Reserve Chair Jerome Powell signaled the possibility of an interest rate cut, sparking a broad crypto market surge.
Interestingly, over the past two months, Ethereum’s price has more than doubled, outpacing Bitcoin (BTC) as investors pour into exchange-traded funds.
By press time, Ethereum was trading at $4,713, up 8.5% in the past 24 hours and nearly 6% higher on the week.
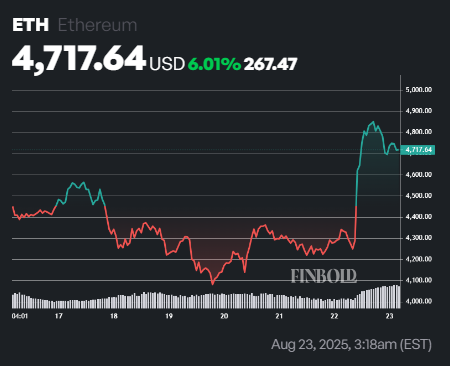 ETH seven-day price chart. Source: Finbold
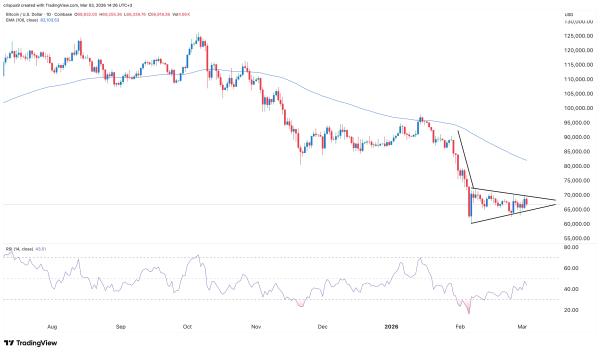
Notably, Ethereum remains well above both its 50-day simple moving average (SMA) of $3,674 and 200-day SMA of $2,679. The alignment of short- and long-term averages confirms sustained bullish momentum.
Meanwhile, the 14-day relative strength index (RSI) stands at 66.66, edging closer to the overbought threshold of 70. This suggests that while buying pressure is dominant, the asset is nearing levels where a short-term pullback could emerge.
Featured image via Shutterstock