Bitcoin Whales Trapped at the $74,000 Top? Hints of an Escape Plan Emerge
Bitcoin’s recent price action has already followed a warning we highlighted earlier. When the asset was trading close to $73,000, we noted that weakening momentum could push the price lower.
Since then, Bitcoin has fallen sharply and is currently trading near $68,000 at press time.
The move comes during a weekend session when liquidity is typically thinner, meaning price swings can appear sharper and less predictable. While the drop confirms short-term weakness, the market structure now reveals a more complex situation. Some signals suggest another bounce may appear, even as a larger bearish setup remains active.
Bitcoin Head-and-Shoulders Pattern Forms as Whales Buy the $74,000 Top
On the 4-hour chart, Bitcoin appears to be forming a head-and-shoulders pattern. This is a technical structure that often signals a potential trend reversal when the neckline breaks.
The pattern began forming after Bitcoin pushed toward $74,100 earlier this week. That level now represents the “head” of the formation. Since then, the price has gradually weakened, with the right shoulder now developing.
Want more token insights like this? Sign up for Editor Harsh Notariya’s Daily Crypto Newsletter here.
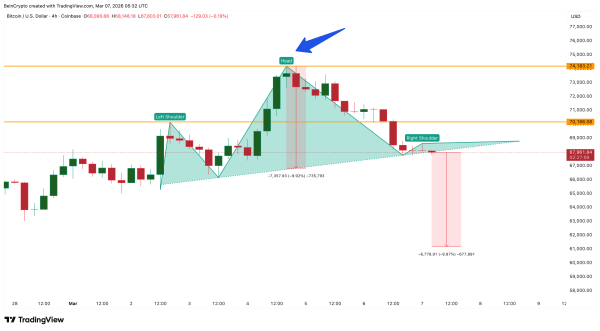 $BTC Price Structure”> $BTC Price Structure: TradingView
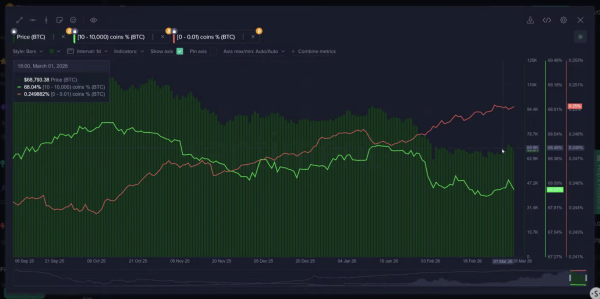
At the same time, large Bitcoin wallets appear to have increased their exposure near the peak. Data tracking wallets holding between 10,000 and 100,000 $BTC shows reserves rising to roughly 2.24 million $BTC on March 4, which coincides closely with the formation of the pattern’s head. This timing raises a key question: Did whales buy the top?
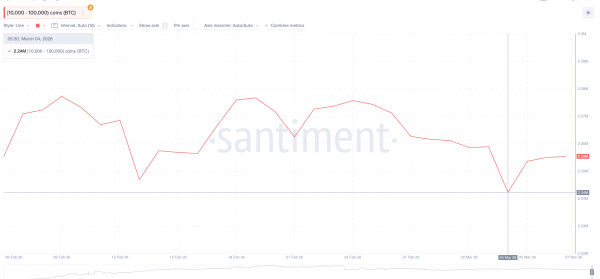 $BTC Whales”> $BTC Whales: Santiment
If so, the recent drop to $68,000, which was predicted 48 hours earlier, places them in a potentially uncomfortable position.
Don’t tag me a party pooper but I seriously think $BTC can quickly correct to $68,000. Breaking and holding above $ 73,500 can invalidate this bearish, irritating hypothesis. #CryptoMarket #bitcoin pic.twitter.com/xUDmMrEOHa
— charlie0.eth (@A_B_boying) March 5, 2026
But several market signals suggest they may still have an opportunity to minimize losses with a layered short-term bounce.
Short Liquidations and Long-Term Holder Buying Could Fuel a Bounce
Derivatives positioning currently shows a heavy short bias in the market. On the Binance $BTC/USDT perpetual pair, roughly $798 million in short leverage sits in the market compared with about $430 million in long positions. Shorts outweigh longs by over 80%.
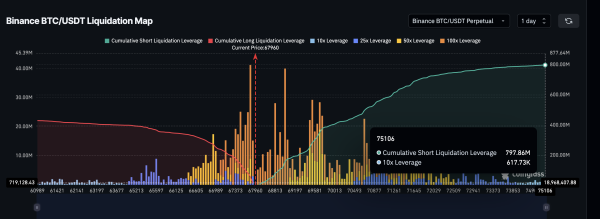 Liquidation Map: Coinglass
This imbalance means that if the Bitcoin price begins to move upward, short positions may start getting liquidated, forcing traders to buy back Bitcoin and pushing prices higher.
One of the largest liquidation clusters sits above the $69,700 region, where nearly $375 million worth of short positions could be wiped out. Interestingly, this level also aligns with a key resistance level (chart revealed later), strengthening its importance as a potential short-term target.
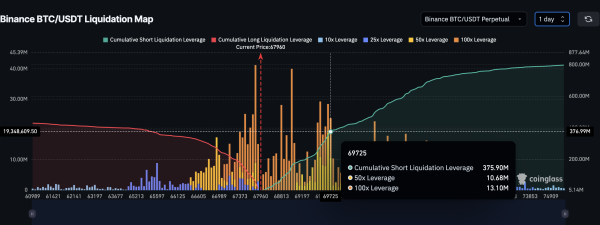 $BTC Liquidation Cluster”> $BTC Liquidation Cluster: Coinglass
Another signal adds to the possibility of a bounce. Bitcoin’s long-term holder net position change, which tracks investors holding $BTC for over a year, has suddenly flipped positive after nearly two months of steady selling.
The metric turned positive on March 6 after staying negative since early January. The last time a similar one-day flip appeared was on December 7, when Bitcoin rallied from about $90,400 to $92,700, a move of roughly 2.5%.
A similar 2.5% bounce from the current price would place Bitcoin almost exactly near $69,700, aligning with the short-liquidation cluster and the technical resistance zone.
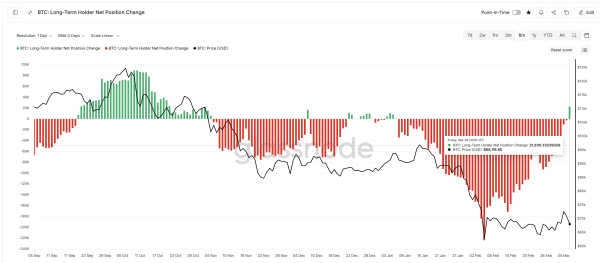 Long-Term Holders: Glassnode
This overlap raises the possibility that whales could be expecting a short-squeeze-driven bounce that temporarily lifts the market.
Key Bitcoin Price Levels to Watch as the Pattern Develops
Despite the potential for a bounce, the broader technical structure remains weak.
For short-term bullish momentum to strengthen, Bitcoin would need to close a four-hour candle above $68,600, which could open the path toward the $69,700 liquidation cluster and potentially $72,000.
However, even a move toward these levels would still keep the head-and-shoulders pattern intact as long as Bitcoin remains below the $74,100 peak.
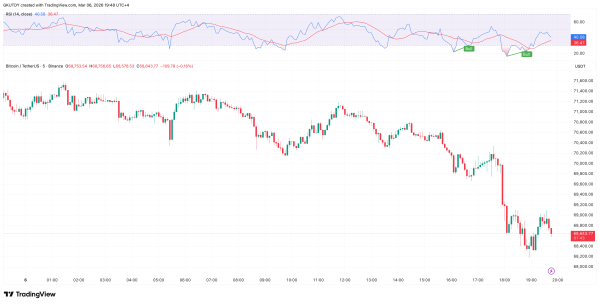
Bitcoin Price Analysis: TradingView
On the downside, the critical neckline sits near $67,800. A four-hour close below this level could confirm the pattern. It would then trigger a deeper decline toward $65,300, with the measured move pointing to roughly $61,100.
For now, Bitcoin sits in a delicate balance. A short squeeze could produce a temporary bounce toward the $69,700 region. But unless the asset reclaims its previous highs, the broader risk of a larger pullback remains in play.
The post Bitcoin Whales Trapped at the $74,000 Top? Hints of an Escape Plan Emerge appeared first on BeInCrypto.