Bitcoin RSI Shows a Familiar Pattern From the End of the 2022 Bear Market
Traders are closely watching Bitcoin as a familiar technical pattern begins to emerge. The stochastic relative strength index (RSI) on the daily timeframe is showing behavior strikingly similar to what preceded the price rebound in early 2023.
This resemblance has captured market attention, especially as the standard RSI is also beginning to flash signals that could point to a potential bottom.
A Familiar Pattern Returns on the Stochastic RSI
The stochastic RSI, a more reactive version of the classic Relative Strength Index, is designed to identify overbought and oversold conditions more quickly. It ranges from 0 to 100, with readings below 30 typically indicating oversold conditions and readings above 70 signaling overbought levels.
According to trader Quantum Ascend, the current stochastic RSI levels are nearly identical to those seen at the end of 2022. At that time, both price action and the indicator formed a double bottom before Bitcoin launched into a strong rally in early 2023.
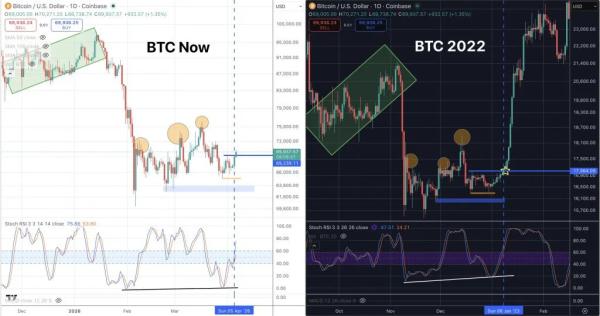 $BTC/USD and RSI comparison 2022 vs. 2026. Analysis by Quantum Ascend.
Bitcoin ultimately reached a multi-year low near $15,600 during that period: a level that marked the bottom of the bear market.
Now, traders believe a similar setup may be unfolding again. The indicator is attempting to break above the 50 level after forming two local lows in late January and late March. A confirmed breakout above this midpoint could act as a longer-term bullish signal.
RSI Divergence Adds to Bullish Expectations
Beyond the stochastic RSI, analysts are also highlighting notable movements in the standard RSI.
Despite relatively weak price action, the weekly chart is beginning to show signs of a potential bullish divergence, a classic signal that often precedes reversals.
What traders are watching next
Trader Jelle has pointed out the importance of a higher low forming on the weekly RSI. If confirmed over the coming weeks, this could strengthen the case for a broader recovery.
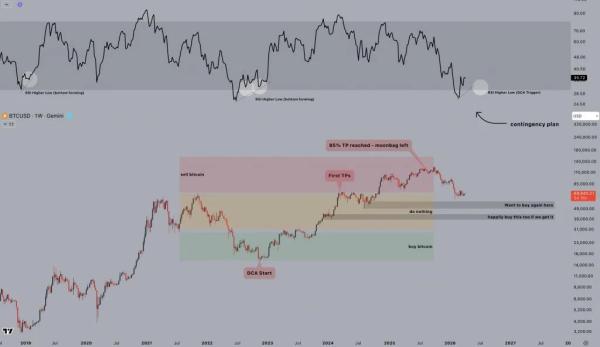 $BTC/USD 1-Week Chart. Analysis by Jelle.
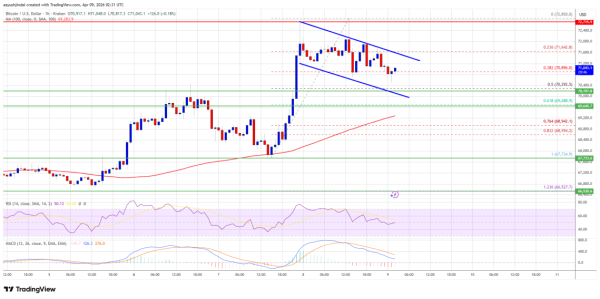
However, risks remain. On the daily timeframe, Bitcoin still faces the possibility of a bear flag breakdown: a pattern that could lead to further downside before any sustained recovery begins.
Analyst Aksel Kibar notes that the coming days will be critical in determining whether the current setup confirms a reversal or continues the existing trend.
While history rarely repeats itself perfectly, the alignment of both stochastic RSI and standard RSI patterns is drawing increased attention. For many traders, this convergence of signals suggests that Bitcoin may be approaching a pivotal moment once again.