Bitcoin ‘is done’ if it crosses this level, according to expert
Bitcoin ‘is done’ if it crosses this level, according to expert 
![]() Cryptocurrency Jan 27, 2026 Share
Cryptocurrency Jan 27, 2026 Share
Bitcoin (BTC) is approaching a make-or-break technical level that has historically defined the transition from bull markets to deep bear cycles, according to a trading expert.
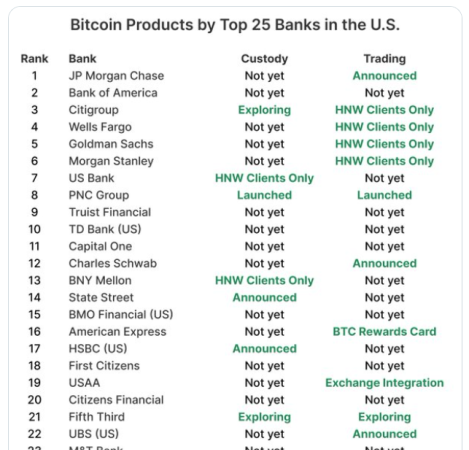
This outlook comes after Bitcoin lost the $90,000 support amid the broader cryptocurrency market sell-off, partly triggered by waning interest in risk assets. To this end, Bitcoin has seen a notable exodus of institutional investors.
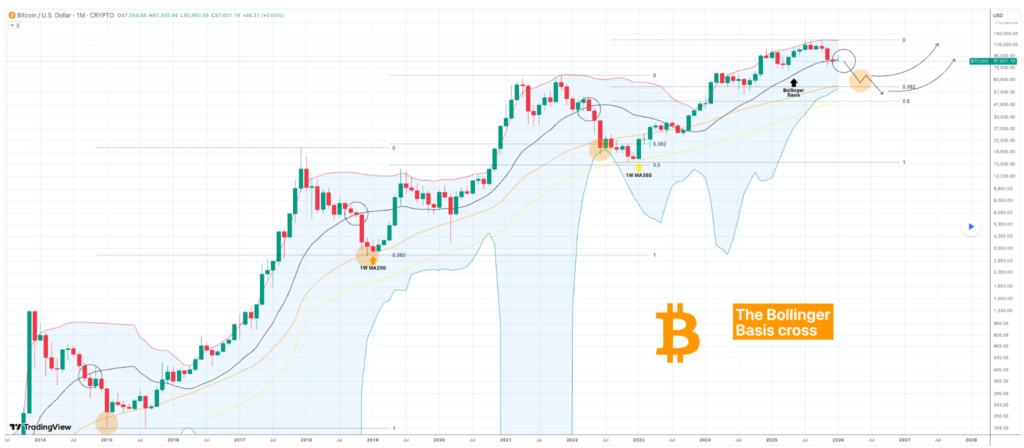
Now, a TradingShot analysis shared on TradingView on January 26 shows Bitcoin trading just below the one-month Bollinger Bands Basis in the mid-$80,000s, with the spot price near $87,000 as the monthly close approaches. The analysis warns that time is running out for a recovery, as failure to reclaim this level has historically carried major downside implications.
 Bitcoin price analysis chart. Source: TradingView
The one-month Bollinger Bands Basis has served as a long-term regime divider for more than a decade. Over the past 12 years, every monthly close below this level has signaled the start of Phase 2 of a bear cycle. Bitcoin has now spent three straight months testing and trading below the basis, a setup that has never turned bullish without a decisive month-end reclaim.
Key Bitcoin price levels to watch
A confirmed monthly close below the $85,000–$88,000 zone would likely expose deeper weekly support, with the first major downside target at the one-week MA200 near $50,000, a level reached in every bear cycle and which marked the January 2015 and December 2018 bottoms.
TradingShot also pointed to the one-week MA350 in the mid- to high-$40,000s as a more complete bear-cycle target. This moving average marked the November 2022 bottom and, in the prior cycle, was not tested until the bearish phase was fully exhausted.
A potential bottom around $50,000 aligns with the 0.382–0.5 Fibonacci retracement of the full bull-market advance, a zone that has contained all prior cycle lows. The convergence of the weekly MA200, MA350, and Fibonacci support reinforces this area as a likely macro floor if bearish conditions persist.
The analysis notes that a new bull cycle has only been confirmed after Bitcoin reclaimed and held above the one-week MA200, as seen in March 2023. Until a similar reclaim occurs, a monthly close below the one-month Bollinger Bands Basis would statistically signal bear-market continuation rather than a temporary correction.
Bitcoin price analysis
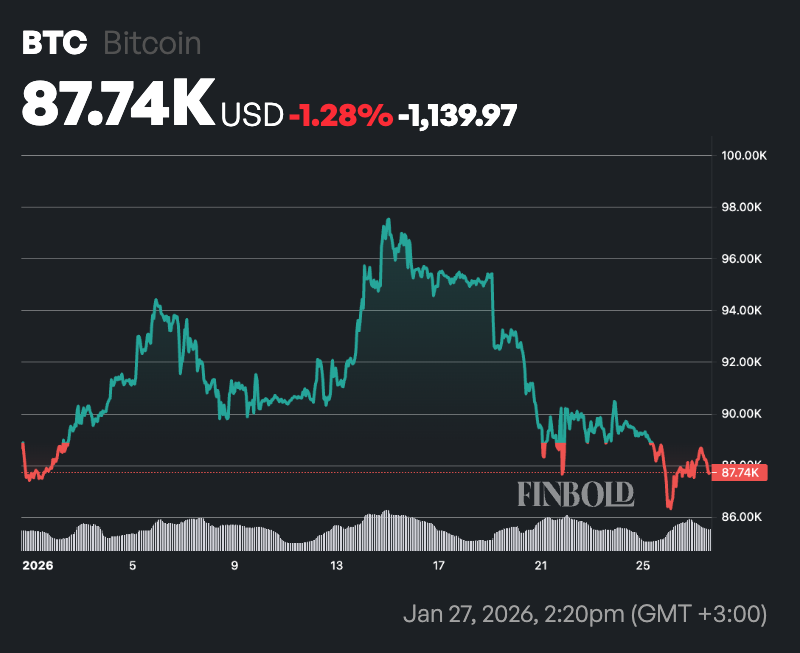
By press time, Bitcoin was trading at $87,762, down more than 3% on the weekly timeframe. Year-to-date, the leading cryptocurrency is down less than 1%.
 Bitcoin seven-day price analysis. Source: Finbold
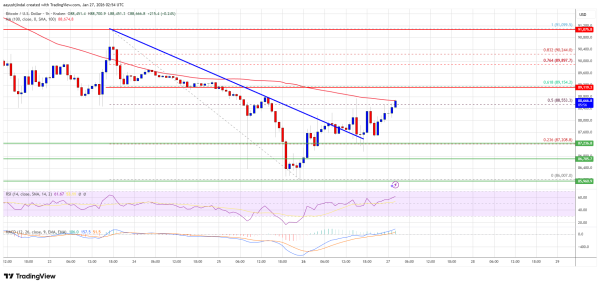
From a technical perspective, Bitcoin’s price sits below both key moving averages, the 50-day simple moving average at $90,192 and the 200-day simple moving average at $104,666, a classic bearish signal indicating that both the short- and long-term trends remain under downward pressure.
Meanwhile, the 14-day Relative Strength Index stands at 41.64, which is neutral but skewed toward weakness, suggesting limited bullish momentum at present.
Featured image via Shutterstock