Bitcoin Enters Danger Zone Weeks: Why Analysts Expect Volatility Ahead
Story Highlights
-
Bitcoin’s cycle clock ticking: Analysts say BTC could peak between October–December, echoing past 1,060-day cycle patterns.
-
Volatility ahead: Weeks 6–8 mark “danger weeks” as Bitcoin rejects $114K resistance, mirroring previous mid-cycle pullbacks.
Bitcoin is once again at one of those moments where history doesn’t repeat, but it sure does rhyme. Analysts are saying that the world’s biggest cryptocurrency is moving in ways that look eerily familiar to its past cycles. For seasoned investors, that’s both exciting and nerve-wracking as we head into the final stretch of the year.
The cycle clock is ticking
Analyst Benjamin Cowen said that Bitcoin’s previous two cycles ran for about 1,060 days before hitting their peaks. Today, we’re sitting around day 1,016. In plain English: if history lines up, Bitcoin could be staring at a potential top sometime between October and December.
Here’s the catch: Bitcoin has never peaked in October before. Its past blow-off tops happened in November and December. But the timing of this current run puts October right in the spotlight, meaning the market is entering a window worth watching very closely.
The “danger weeks” of price discovery
Analyst Rekt Capital has taken things a step further by breaking down Bitcoin’s price discovery stages week by week. And the pattern is striking:
- In 2013, Bitcoin ran for six weeks before a sharp correction hit in Week 7.
- In 2017, it stretched to seven weeks, only to crash 34% in Week 8.
- In the 2020–21 run, the rally lasted six weeks before a 30% pullback.
- In the current 2025 cycle, Bitcoin ran seven weeks into Price Discovery before sliding 32%.
- And now? We’ve just entered Week 6 of the second price discovery uptrend — and the pullback has begun.
Rekt Capital calls Weeks 6 to 8 the “problem weeks” for Bitcoin. That’s when volatility usually spikes and traders get shaken out. But here’s the good news: historically, these rocky weeks also opened the door to strong opportunities before the next leg higher.
Today’s chart says… rejection
On the charts, Bitcoin has just rejected resistance around $114,000 on the daily timeframe.
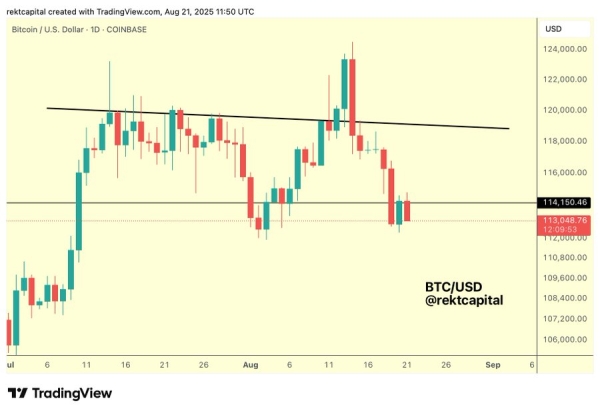
That rejection lines up almost perfectly with the historical script: a mid-cycle pullback right when things looked unstoppable.