Legendary trader Peter Brandt maps Bitcoin’s crash to $58,000
Legendary trader Peter Brandt maps Bitcoin’s crash to $58,000 
![]() Cryptocurrency Jan 20, 2026 Share
Cryptocurrency Jan 20, 2026 Share
Veteran market technician Peter Brandt is warning that Bitcoin (BTC) could be headed for a deeper pullback toward the $58,000 to $62,000 range, based on a bearish technical structure visible on the daily chart.
Brandt, who carries over four decades of experience, noted that Bitcoin is breaking down from a broader topping formation after failing to sustain upside momentum near the upper boundary of a long-term range.
In an X post on January 20, the analyst said that multiple lower highs and a decisive violation of key support around the low-$100,000 area signaled a shift in trend.
The subsequent selloff accelerated once the price fell below the rising support line that had guided the market higher through late 2025.
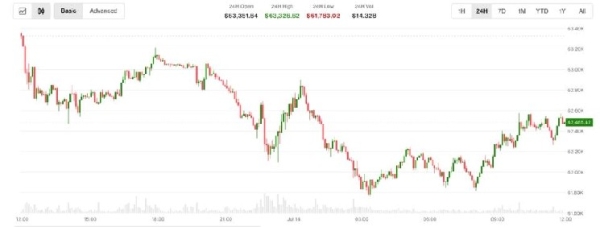
 Bitcoin price analysis chart. Source: Peter Brandt
From a technical perspective, the structure resembles a completed distribution pattern, with price now consolidating inside a narrower rising channel that appears corrective rather than impulsive.
Bitcoin’s failure to reclaim former support in the $98,000–$102,000 zone strengthens the bearish case, with that area now acting as overhead resistance. Momentum indicators remain muted, suggesting the rebound lacks the strength typical of a sustainable trend reversal.
Notably, Brandt’s downside target reflects a measured-move decline from the prior breakdown, placing key support between roughly $58,000 and $62,000. This zone also aligns with mid-2025 consolidation, adding technical significance. A deeper push into the low-$60,000s is possible if the current corrective structure resolves lower.
Crucially, Brandt framed the outlook as probabilistic rather than certain, acknowledging that being wrong is part of trading and emphasizing disciplined risk management, hallmarks of his long career.
Bitcoin price analysis
By press time, Bitcoin was trading at $90,991, having dropped by almost 2% in the past 24 hour,s while on the weekly timeline, BTC is down 1.7%.
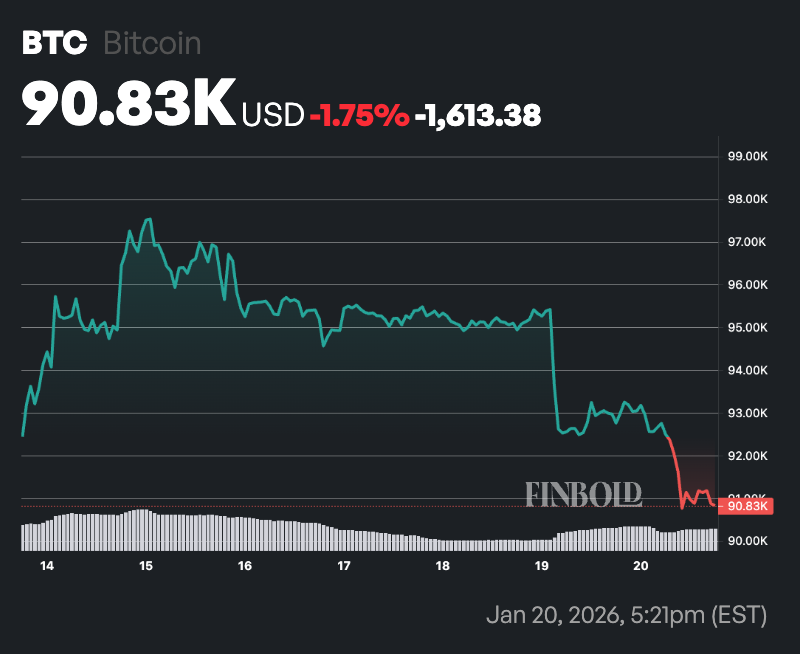 Bitcoin seven-day price chart. Source: Finbold
At the current price, Bitcoin is sitting marginally above its 50-day simple moving average around $90,402 but well below the 200-day SMA near $105,391. This configuration points to short-term stabilization without a confirmed trend reversal, as the long-term moving average continues to slope overhead and acts as a key resistance zone.
On the other hand, the 14-day RSI at roughly 54 reinforces this view. Momentum is neutral, indicating neither overbought nor oversold conditions, and signaling a lack of strong directional conviction.
Featured image via Shutterstock