Bitcoin Price Rips Higher, $100K Narrative Gathers Pace
Bitcoin price started a fresh increase above $92,500. BTC is trading above $95,000 and attempting a close for another increase to $100k.
- Bitcoin started a decent increase above $92,000 and $94,500.
- The price is trading above $95,000 and the 100 hourly Simple moving average.
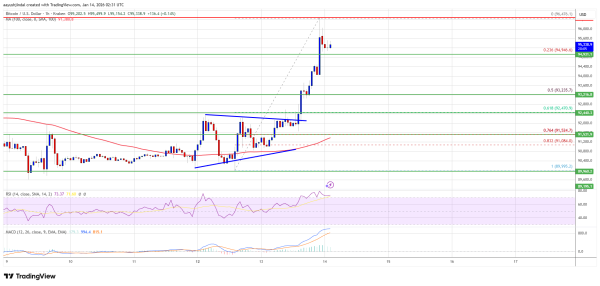
- There was a break above a contracting triangle with resistance at $92,000 on the hourly chart of the BTC/USD pair (data feed from Kraken).
- The pair might continue to move up if it stays above the $94,000 zone.
Bitcoin Price Gains Over 4%
Bitcoin price managed to stay above the $90,500 support and started a fresh increase. BTC was able to settle above $92,000 and $92,500.
There was a break above a contracting triangle with resistance at $92,000 on the hourly chart of the BTC/USD pair. The bulls were able to push the price above $93,500. Finally, the price spiked above $96,000. A high was formed at $96,476, and the price is now consolidating gains above the 23.6% Fib retracement level of the recent wave from the $89,995 swing low to the $96,476 high.
Bitcoin is now trading above $95,000 and the 100 hourly Simple moving average. If the price remains stable above $94,500, it could attempt a fresh increase. Immediate resistance is near the $96,000 level. The first key resistance is near the $96,500 level.
The next resistance could be $96,800. A close above the $96,800 resistance might send the price further higher. In the stated case, the price could rise and test the $98,000 resistance. Any more gains might send the price toward the $98,500 level. The next barrier for the bulls could be $99,000 and $100,000.
Another Drop In BTC?
If Bitcoin fails to rise above the $96,000 resistance zone, it could start another decline. Immediate support is near the $95,000 level. The first major support is near the $94,500 level.
The next support is now near the $93,200 zone or the 50% Fib retracement level of the recent wave from the $89,995 swing low to the $96,476 high. Any more losses might send the price toward the $92,500 support in the near term. The main support sits at $91,500, below which BTC might accelerate lower in the near term.
Technical indicators:
Hourly MACD – The MACD is now losing pace in the bullish zone.
Hourly RSI (Relative Strength Index) – The RSI for BTC/USD is now above the 50 level.
Major Support Levels – $95,000, followed by $94,500.
Major Resistance Levels – $96,000 and $96,800.