Bitcoin’s price hasn’t peaked yet and its just a ‘mid-cycle’ correction, historical data shows
A new debate has been raging between bitcoin bulls and bears: Has the bitcoin price peaked for this cycle?
The debate follows bitcoin’s sharp drop from its all-time high of $126,000 in early October to around $90,000. This pullback aligns with the cryptocurrency’s historical pattern of topping out roughly 18 months after each mining reward halving, as seen in November 2021 and December 2017, with the latest halving in April 2024. Halving is a programmed cut in the pace of BTC’s supply expansion by 50% every four years.
Bears, emboldened by this timeline, predict that the price has already topped for this cycle and there is no more fuel left for another rally. They expect a year-long bear market similar to those following the 2021 and 2017 peaks.
But there’s a catch that weakens the bear case.
While each of the previous euphoric cycle peaks in 2013, 2017 and 2021 were followed by year-long bear markets, the steepest declines actually occurred in first three months following price peaks. For instance, in 2021, 2017 and 2014, prices dropped 51%, 70% and 71% in first 90 days after bull market peaks.
But this time, the decline has been shallower. BTC dropped 36% in 90 days following the Oct 8 peak of $126,000.
This sell-off actually matches previous mid-cycle corrections rather than the full blown bearish trends.
Perhaps, there is plenty upside left as many argue, expecting continued institutional adoption via ETFs to power BTC to new highs this year, invalidating the four-year boom-bust cycles.
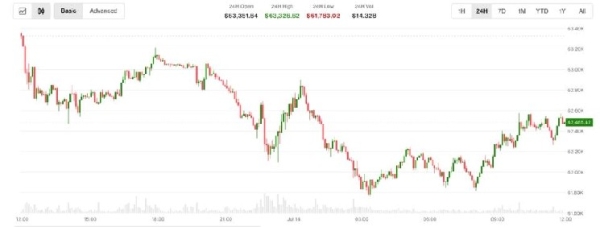
 BTCUSD (TradingView)
So, where is the bitcoin price during this time compared to previous cycles? The answer may be in how the selloffs have occurred since the bull run began in early 2023.
This time, the price has already experienced two prior drawdowns exceeding 30%, particularly following the U.S. spot ETF launch in January 2024. The 2024 correction lasted 147 days, from peak to trough, while the U.S. tariff-driven correction in 2025 lasted 77 days.
The current correction has lasted only 46 days so far, assuming $80,000 was the bottom.
In this context, the size of drawdown and the days it took for the correction more closely resemble previous mid-cycle pullbacks due to price having less than a 50% drawdown, rather than the deep drawdowns historically associated with bitcoin cycle tops within the first 90 days.
While bitcoin has already reclaimed the 50 day moving average at $89,400. Reclaiming the 50 day moving average is considered bullish because it suggests buyers have regained control, momentum is shifting upward.
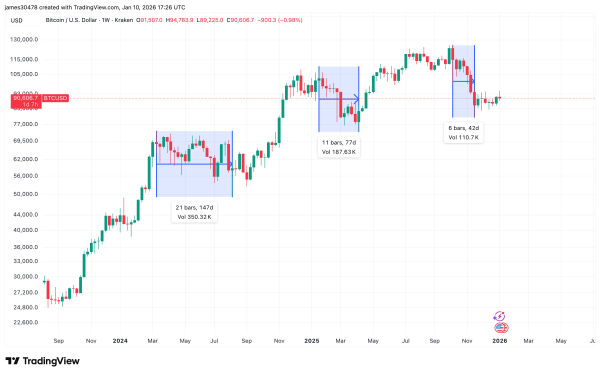 BTCUSD (TradingView)
As the debate over the four-year cycle rages on, the data currently suggests that this is just a pause in bitcoin’s rally, not the end of it. While nobody has a crystal ball to see into the future, investors likely will have to stick with what the charts and the data are showing, for now.