Bitcoin Rainbow Chart predicts BTC price for July 1, 2026

The Bitcoin Rainbow Chart prediction suggests the cryptocurrency could trade between $99,143 and $1.16 million by July 1, 2026, depending on which valuation band Bitcoin (BTC) occupies within the model.
With Bitcoin trading at round $64,500 on June 14, the long-term valuation model places BTC below even the lowest projected Rainbow Chart level for July 2026. Rather than forecasting an exact price target, the chart uses a logarithmic growth curve to determine whether Bitcoin is historically undervalued, fairly valued, or overvalued.
According to the model, the lowest ‘Fire Sale!’ band sits at $99,143 and represents extreme undervaluation. The ‘BUY!’ band is projected at $134,755, followed by ‘Accumulate’ at $184,990 and ‘Still Cheap’ at $249,738, all of which suggest Bitcoin remains undervalued relative to its long-term trend.
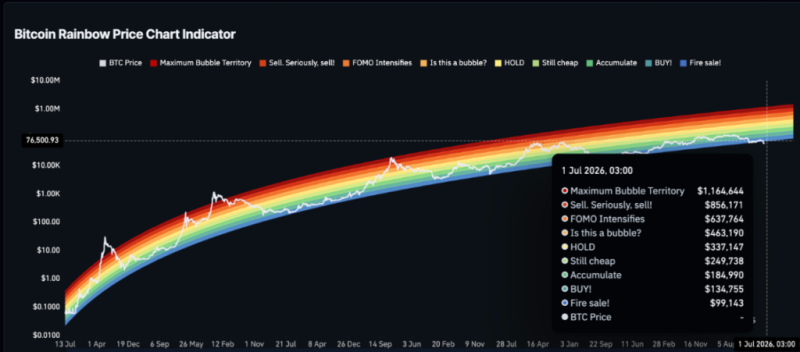
Bitcoin Rainbow Chart. Source: CoinGlass
The ‘HODL’ band is projected at $337,147 and is generally considered fair-value territory. Above that, the ‘Is this a bubble?’ band stands at $463,190, while ‘FOMO Intensifies’ is projected at $637,764, reflecting growing speculative demand.
The model’s highest valuation zones are Sell. Seriously, sell! at $856,171 and Maximum Bubble Territory at $1,164,644, levels historically associated with overheated market conditions.
At its current price, Bitcoin remains about 53.5% below the projected ‘Fire Sale!’ level for July 2026. Reaching the model’s fair-value ‘HODL’ band would require a gain of roughly 422%, while a move into ‘Maximum Bubble Territory’ would imply upside of more than 1,700%.
Notably, the Rainbow Chart is widely used as a long-term Bitcoin valuation model because it places price action within the context of previous market cycles, helping identify periods of undervaluation and overvaluation rather than predict precise future prices.
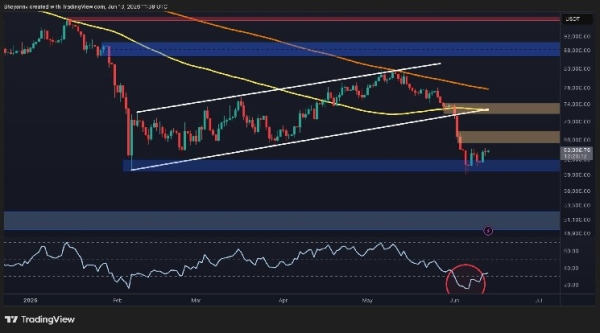
Bitcoin price analysis chart
By press time, Bitcoin was trading at $64,587, up about 1% over the past 24 hours and more than 3% on the week.

Bitcoin seven-day price chart. Source: Finbold
Despite the recent gains, Bitcoin remains in a bearish trend, with its price trading well below the 50-day simple moving average (SMA) of $74,202 and the 200-day SMA of $77,804, indicating continued weakness across both medium- and long-term timeframes.
Meanwhile, the 14-day Relative Strength Index (RSI) stands at 36.34, remaining in neutral territory but nearing oversold levels. This suggests selling pressure is still dominant, although a recovery in buying momentum could support a short-term rebound.