Will Bitcoin drop below $60K as market selling pressure intensifies?

Bitcoin slipped below $62,000 on Friday, briefly approaching the $61,000 level as weakening demand and rising selling pressure from short-term holders weighed on sentiment.
The move comes amid a broader risk-off environment across global markets. The momentum indicators remain bearish, suggesting further selloff in the near term.
Bitcoin demand continues to decline
Bitcoin is down by more than 1% in the last 24 hours and is now trading above $62,000.
The coin briefly touched the $61,100 level during the early hours of Friday but has now slightly recovered to above $62,000.
The bearish performance comes amid a demand decline for Bitcoin.
New on-chain data from CryptoQuant highlights a significant contraction in market activity, suggesting that overall demand for Bitcoin has deteriorated to its weakest point in the current cycle.
The data revealed that spot demand has fallen to -272,000 $BTC on a 30-day cumulative basis, while futures demand has dropped to -229,000 $BTC.
Thanks to this latest development, total demand contraction now sits near 501,000 $BTC.
The demand contraction indicates that selling pressure has consistently outweighed buying activity throughout most of the year, even during brief periods of institutional inflows.
According to analysts, this decline is due to the negative macroeconomic conditions, including elevated bond yields, persistent inflation, and geopolitical uncertainty.
In this environment, liquidity has reportedly shifted toward equities—especially tech and AI stocks—as well as forex and precious metals.
On-chain behavior shows that short-term holders (STHs) have undergone one of the largest capitulation events of the year.
The report highlighted that around 53,800 $BTC were sent to exchanges at a loss, while inflows from profitable positions dropped to near zero.
This pattern reflects growing panic among recent buyers as unrealized losses deepen.
Historically, similar capitulation events have often appeared near local market bottoms, though analysts caution they are not reliable reversal signals on their own.
Continued selling, however, could extend the correction if demand fails to recover. Despite that, the oversold conditions could indicate that the bottom is approaching.
Market sentiment weakened further after Strategy disclosed its first Bitcoin sale in over four years, selling 32 $BTC to fund preferred stock dividend payments.
The company’s Bitcoin holdings are now facing an estimated $10.8 billion unrealized loss, according to market commentary.
https://twitter.com/Kalshi/status/2062517164838363342
Bitcoin technical outlook: Bearish structure remains intact
The $BTC/USD 4-hour chart is extremely bearish as Bitcoin is trading below the 20, 50, and 100-day exponential moving averages.
These averages form a resistance layer between approximately $72,900 and $75,800.
Momentum indicators show deeply oversold conditions. RSI near 27, signaling extreme downside momentum, while the MACD lines are also in oversold territory
While these readings suggest selling may be stretched, price action remains capped beneath major resistance.
If the bulls regain control, initial resistance emerges around $65,103. An extended rally would allow $BTC to rally towards the major resistance zones between $72,874–$75,796.
However, Bitcoin has lost the $62,520 support level, and if the selloff continues, it could drop towards the $59,058 secondary support.
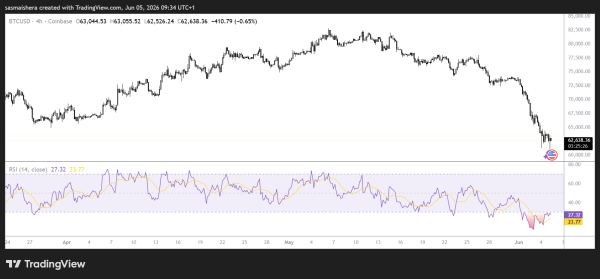
A daily candle close below this support would expose the $55,770 deeper downside level.
A sustained move back above the EMA cluster would be required to shift sentiment away from the current bearish bias.