Bitcoin Price Prediction Amid Mid April Breakdown Risk
Bitcoin is showing two very different chart signals at the same time. One pattern warns that another downside move could start soon, while the bigger monthly setup suggests the market may already be near a broader bottom zone.
Bitcoin Chart Suggests Mid April Risk as 68 Day Sideways Pattern Repeats
The chart shared by Ted compares Bitcoin’s current structure with an earlier setup that ended in a sharp drop after a long sideways period. In both cases, price moved above a rising support line, traded in a range for 68 days, and then faced heavy downside pressure. Based on that comparison, the post argues that Bitcoin could face another breakdown around mid April if the pattern repeats.
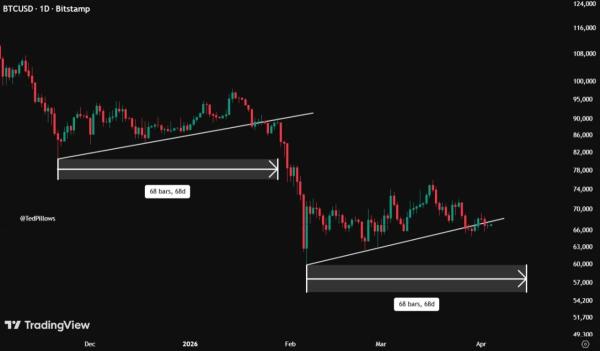
Bitcoin 68 Day Sideways Pattern. Source: Ted
That idea comes from the similarity in timing more than from price alone. The first structure on the left shows Bitcoin moving sideways for 68 days before breaking lower. The second structure on the right marks another 68 day stretch, this time ending around mid April. In other words, the chart treats time symmetry as the main signal.
The rising trendline also matters here because price is again sitting near an ascending support line during the range. In the earlier example, that support did not hold once selling pressure increased. Because of that, the current setup raises concern that another breakdown could follow if buyers fail to defend the same type of structure.
Still, the chart does not confirm that a selloff will happen. Similar time windows can produce different outcomes, and repeating patterns do not always lead to the same result. Therefore, the comparison works more as a warning sign than as proof that a drop is certain.
The gray zones on both sides of the chart appear to map the earlier consolidation area and a possible downside path if weakness returns. That makes the broader message clear: Bitcoin is still in a sideways stretch, but the chart suggests that this type of pause has ended badly before.
So the main takeaway is that Ted sees a possible repeat of Bitcoin’s earlier downtrend setup, with mid April marked as the next risk window. However, the bearish case depends on whether the current range breaks down the way the previous one did.
Bitcoin Alligator Signal Suggests the Cycle Bottom May Be Close
The chart shared by Titan of Crypto uses the Alligator indicator on the monthly timeframe to compare Bitcoin’s current setup with past market cycles. The main point is that, in earlier cycles, the green line crossing below the red line appeared near major bottom areas. Because the same type of cross is now shown again, the post suggests Bitcoin may already be at or near a cycle low.
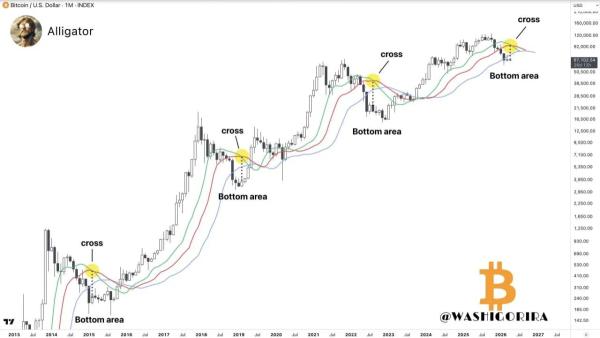
Bitcoin Alligator Bottom Signal. Source: Titan of Crypto
That pattern matters because the chart highlights several earlier periods where this crossover came just before or around a bottoming phase. In each of those cases, Bitcoin later moved into a broader recovery. So the comparison is based on historical timing rather than on a short term price move.
The “bottom area” labels on the chart also show that the crossover did not always mark the exact lowest candle. Instead, it often appeared around the same broader zone where the market formed its base. In other words, the signal may point more to a bottoming region than to one precise turning point.
Still, one indicator alone cannot confirm that the low is fully in. Monthly signals are useful for identifying larger cycle structure, but they do not remove the chance of more volatility or another retest. Therefore, the chart supports the idea of a possible bottom area, not guaranteed confirmation of a full trend reversal.
The broader message is straightforward: Bitcoin’s current monthly Alligator crossover looks similar to signals that appeared near prior cycle lows. If that historical pattern holds again, the market may already be in or near a bottoming phase rather than at the start of a fresh major decline.