Bitcoin Price Eyes Breakout as Spot Bitcoin ETFs See $1.1B Net Inflows
- The Bitcoin price attempts a $74,000 breakout amid renewed ETF inflow and channel pattern formation.
- Bloomberg analyst Eric Balchunas suggests that the recent surge in Bitcoin is potentially driven more by resolved allegations of Jane Street’s market manipulation than by geopolitical tension, including Iran.
- The daily RSI (Relative Strength Index) slope at 52% indicates a bullish to neutral sentiment among market participants.
The Bitcoin price plunged over 2% during Thursday’s U.S. market hours to currently exchange hands at $71,000. The downtick came as a breather after the asset’s early-week rally challenged the $73,000 monthly resistance. While the supply pressure at this barrier persists, the renewed inflow into $BTC’s spot ETF signals the growing demand from institutional investors and a potential for a bullish breakout. Is the pioneer cryptocurrency ready to reclaim $80,000?.
$BTC Recovery Gains Support From ETF Inflows Despite $73K Resistance
The recent recovery attempt from Bitcoin faced overhead supply at $73,100— the key resistance that has been carrying the ongoing consolidation in its price. This downtick raised concern among market participants about whether the recent bounce is an attempt at recovery or just a bull trap.
Amid the price uncertainty, the spot Bitcoin ETFs showcased a renewed interest among institutional investors. According to FarsideInvestors, the U.S-based spot $BTC ETFs collectively witnessed a significant inflow of $461.9 billion, with a lion’s share attracted by iShares Bitcoin Trust ETF (IBIT) for $306 million.
U.S. spot Bitcoin exchange-traded funds have moved significantly in the last sessions. After weeks of consistent capital withdrawals, the products saw a massive amount of net purchases totaling around $1.1 billion on March 2-4, 2026. BlackRock’s IBIT vehicle dominated several days, attracting hundreds of millions all by itself.
This reversal caused the smoothed 14-day average for net flows to be pushed well into the positive. The change occurred as the Bitcoin price showed a bullish rebound above $70,000 and briefly retested the $74,000 despite the general market uncertainty and geopolitical tension.
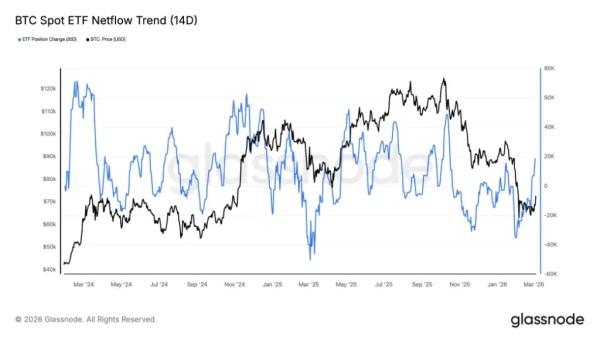
On-chain analytics suggest the move signals a decrease in selling intensity from previous times and some large holders are starting to fill out positions quietly. Daily inflows varied but remained positive in aggregate throughout the March slice, although spot trading remained range-bound in some areas of the week. Institutional participation seems to be on track without aggressive conviction yet.
Bitcoin Price Regains Bullish Momentum at Channel Support
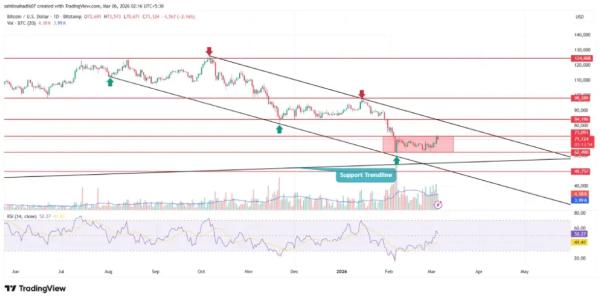
Over the past month, the Bitcoin price has resonated strictly within the two horizontal levels of $73,000 and $62,500. As the recent recovery attempt struggles to surpass $73k, the $BTC price is anticipated to prolong its consolidation.
However, the daily chart analysis shows the lateral trend in $BTC is positioned at the bottom trendline of a falling channel pattern. Since August 2025, the support trendline has cushioned the $BTC buyers to replenish the bullish momentum and drive a renewed recovery.
If history repeats, Bitcoin could breach the $73,000 resistance and attempt a surge of roughly 10% to challenge the pattern’s resistance trendline at $80,000 as per the $BTC price prediction.
 $BTC/USDT -1d Chart
A bullish breakout from this barrier will signal the end of the current correction and bolster the Bitcoin price to sustain $80,000 and drive a higher recovery.