Crypto Market Review: One Shiba Inu (SHIB) Fail After Another, Will XRP’s Price Slide Toward $1.60? Bitcoin (BTC) $70,000 Breakout Is Still Possible
The market is taking one hit after another, mostly due to an unstable risk profile: institutional investors are not yet convinced, while retailers lack liquidity to keep the market on its feet. It is reflected on the charts of both smaller and larger assets like Shiba Inu and Bitcoin, for example.
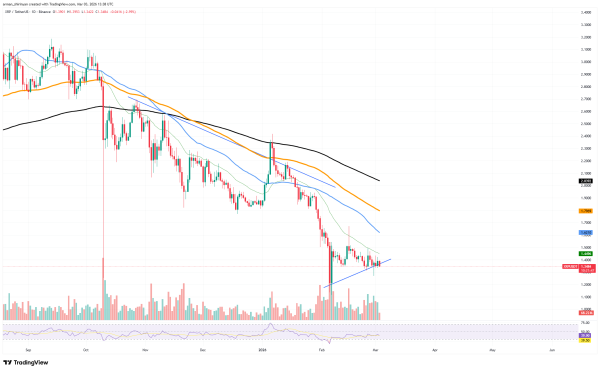
Another $SHIB breakdown
The price of Shiba Inu keeps breaking below short-term consolidation triangles that at first seemed to offer stabilization, resulting in one technical failure after another. For a brief period, each of these formations hinted at a possible reversal, or at the very least, a halt to the decline. Rather, they have decided to go lower, which has strengthened the ongoing bearish control.
$SHIB‘s price has now fallen to levels not seen since 2023 on the daily chart. A distinct pattern can be seen in the breakdown of successive triangle structures below: brief compression followed by fresh selling pressure.
All of the major moving averages, which are acting as dynamic resistance zones and are in bearish alignment, are trading below $SHIB. Near these trend indicators, every attempt to move higher has stalled and then rolled over once more.
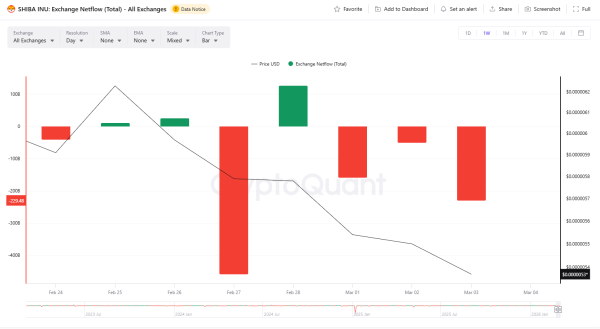
The lack of significant assistance below current levels is what makes the current state of affairs especially worrisome. Demand zones have already been tested and found to be unreliable. Price is more susceptible to rapid drops in the absence of distinct structural floors. Even slight selling pressure can cause disproportionate declines in these circumstances.
Additionally, momentum indicators indicate weakness rather than recovery. There is currently no verified divergence or accumulation pattern strong enough to indicate a long-term reversal, even though oversold conditions may eventually result in a brief rebound.
The unsettling truth is that $SHIB is essentially functioning outside of its previous support clusters. The path of least resistance remains downward until the asset can recover broken levels and create a distinct higher-low structure.
$XRP‘s recovery is not simple
After a protracted decline that drove the asset toward the lower $1.30 range, $XRP is now in a recovery phase. With $XRP creating a short-term rising support line and printing marginally higher lows, the recent price structure demonstrates a modest attempt at stabilization. An important question is raised by this development: is another decline more likely, or can $XRP move closer to the $1.60 level?
The overall trend is still negative, technically. The major moving averages, which continue to slope downward and serve as dynamic resistance zones, are still below $XRP. These levels have capped every attempt at a rally over the previous few months, strengthening the prevailing selling pressure. In order for $XRP to hit $1.60, it must first maintain buying momentum above the $1.45-$1.50 region and reclaim nearby resistance.
It appears that short-term buyers are trying to establish a base because of the rising trendline that is currently supporting the price. Momentum indicators are no longer severely oversold, and volume has stabilized, in contrast to the earlier sharp sell-off. These signals suggest that there may be room for a technical rebound as downside pressure slows.
But there is no assurance that the path will lead to $1.60. This level is a strong resistance cluster because it is close to important moving averages and aligns with previous breakdown zones. The recovery attempt may swiftly collapse if $XRP is unable to maintain the rising support line, allowing for fresh selling in the direction of recent lows.
Continued consolidation between support and overhead resistance is the most likely scenario in the near future. The likelihood of a move toward $1.60 would be greatly increased by a clean break above $1.50 with growing volume. The market might stay range-bound or decline in the absence of such confirmation.
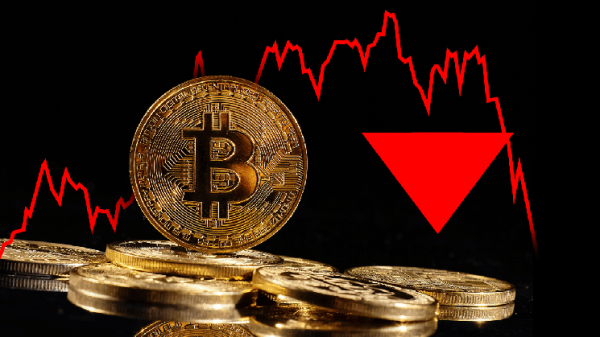
Bitcoin’s breakout possibility
After making a strong comeback from the $63,000 area, which served as a local demand zone after the recent steep sell-off, Bitcoin is trying to regain short-term momentum. Buyers quickly intervened to stop further acceleration of the decline. It may enable, over $65,000, Bitcoin will stabilize.
The price has been steadily rising ever since, creating a tightening consolidation structure just below the $70,000 mark. According to technical analysis, Bitcoin is still below important moving averages on a daily basis, with the closest dynamic resistance being the 26 EMA.
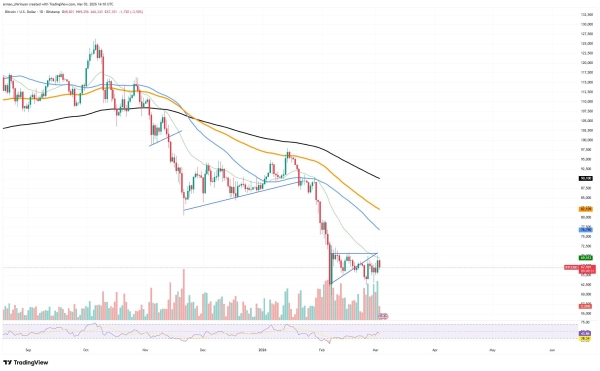
But the price is now getting close to that level once more, and the current structure indicates that there will probably be another test. Even though the overall trend is still cautious, the recent higher lows suggest that short-term bullish pressure is increasing.
Volume dynamics give the recovery effort more weight. A discernible rise in trading activity coincided with the $63,000 bounce, indicating real demand as opposed to a low-liquidity response. It is encouraging that volume has continued to be largely supportive during upward pushes since then. Compared to breakouts that result from waning interest, those that arise from increasing participation typically have better follow-through.
The $70,000 threshold has technical and psychological significance. It is located close to previous breakdown zones and indicates the upper edge of the current consolidation triangle.
Momentum-driven buying and short-covering activity would probably be triggered by a clean break above this area, particularly if it were accompanied by increasing volume. A move like this could quickly change the mood of the market from defensive to cautiously optimistic.