Ethereum ETFs enter 5th week of major outflows
Ethereum ETFs enter 5th week of major outflows 
![]() Cryptocurrency Feb 17, 2026 Share
Cryptocurrency Feb 17, 2026 Share
Spot Ethereum (ETH) exchange-traded funds (ETFs) are facing immense selling pressure, having recorded four consecutive weeks of net outflows.
Over that stretch, between January 17 and February 13, U.S. spot Ethereum ETFs have shed roughly $1.26 billion worth of the cryptocurrency, according to historical data accessible on SoSoValue at press time, February 17.
If redemptions continue this week, the market will thus log a fifth straight week of outflows, a streak not seen since spring 2025, when institutional flows ended up in the red for two months straight between late February and late April.
The signs that outflows might continue are already negative, as Ethereum funds recorded a loss of 22,492 ETH yesterday, Monday, February 16, worth around $44.42 million, as per the latest Lookonchain reports.
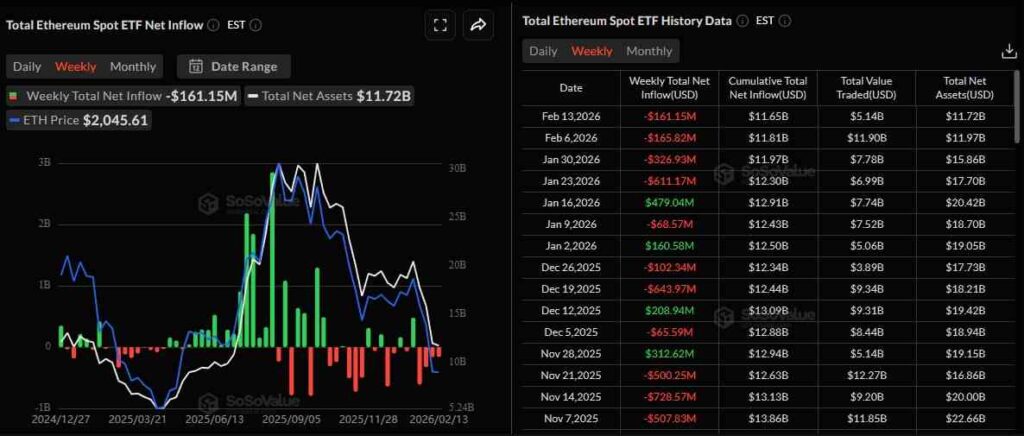 Ethereum ETF moves. Source: SoSoValue
Ethereum ETFs struggle as spot prices fall
The institutional pullback comes amid a sharp correction in Ethereum prices. In fact, over the same period, the spot price has slid from $3,328 to $1,946, a more or less 41% decline.
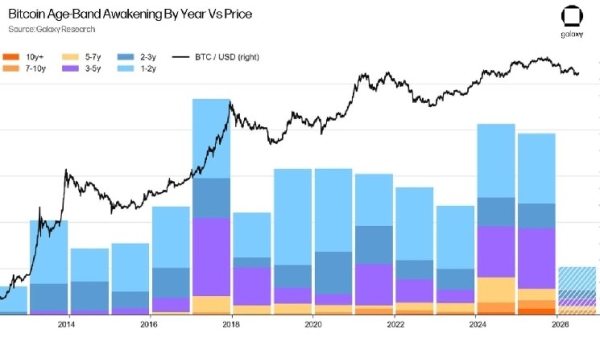
Bitcoin (BTC) is facing a similar problem. Namely, according to SoSoValue statistics, U.S. spot Bitcoin ETFs lost some $1.3 billion at the same time, just as the price fell from $95,598 to $69,382.

The Economics of the Global Online Gambling Business – How Big is it Really?
The global online gambling business is huge. Estimates placed the 2025 market at being worth around $78 billion a year, … Continue reading
Featured Sponsored Feb 16, 2026
At the time of writing, Ethereum was trading at $1,966, down 0.72% on the daily chart, while the total crypto market capitalization slipped 0.97% to $2.34 trillion.
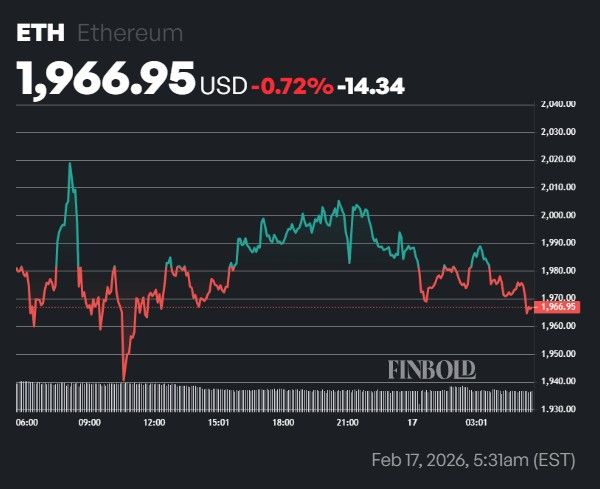 Daily Ethereum price. Source: Finbold
At the same time, the Crypto Fear & Greed Index dropped to 13, firmly in “Extreme Fear” territory and signaling heightened risk aversion. With daily Ethereum trading volumes also down 22%, declining conviction rather than panic-driven selling appears even more likely.
From a technical standpoint, the digital currency is trading below its 200-day Exponential Moving Average (EMA) at $2,027.39, a level widely seen as defining the longer-term trend. Meanwhile, the 7-day Simple Moving Average (SMA) at $1,984.73 has turned into near-term resistance.
Until ETH can reclaim the $2,000–$2,030 range, the path of least resistance appears tilted to the downside. The key question facing the market now is whether Ethereum can at least defend the $1,950 support zone, as a failure to do so could likely lead to a deeper correction.
Featured image via Shutterstock